The scope of this guidance
This guidance provides recommendations for valuation considerations, which will be particularly relevant for impairment exercises and the fair value of unquoted investments, as valuers approach the 31 December 2021 reporting date and beyond.
These valuations will be particularly judgmental as they are performed against the backdrop of public market volatility and concerns regarding the impact of COVID-19, oil and other commodity price movements. Additionally, the impact of a buoyant European transaction market as part of the reported "Deals Led Recovery" will also need to be considered.
Fair value for financial reporting purposes is an exit price concept and therefore inputs need to be based on current market participant assumptions and views.
While valuation will certainly be more tricky and judgmental in the coming period, we are sharing this guidance to emphasise that it remains possible to arrive at a view on value, albeit one with a wider range. The methodologies that we have always applied will likely remain appropriate; what will need to be revised is the information that is flowing into the valuation and how we adjust market inputs if we feel that there is an element of ‘noise’ or excessive volatility.
This UK guidance is primarily focused on the valuation of illiquid assets in the context of the Deals Led Recovery, COVID-19 uncertainty and industry sector volatility faced in public markets across 2020 and 2021
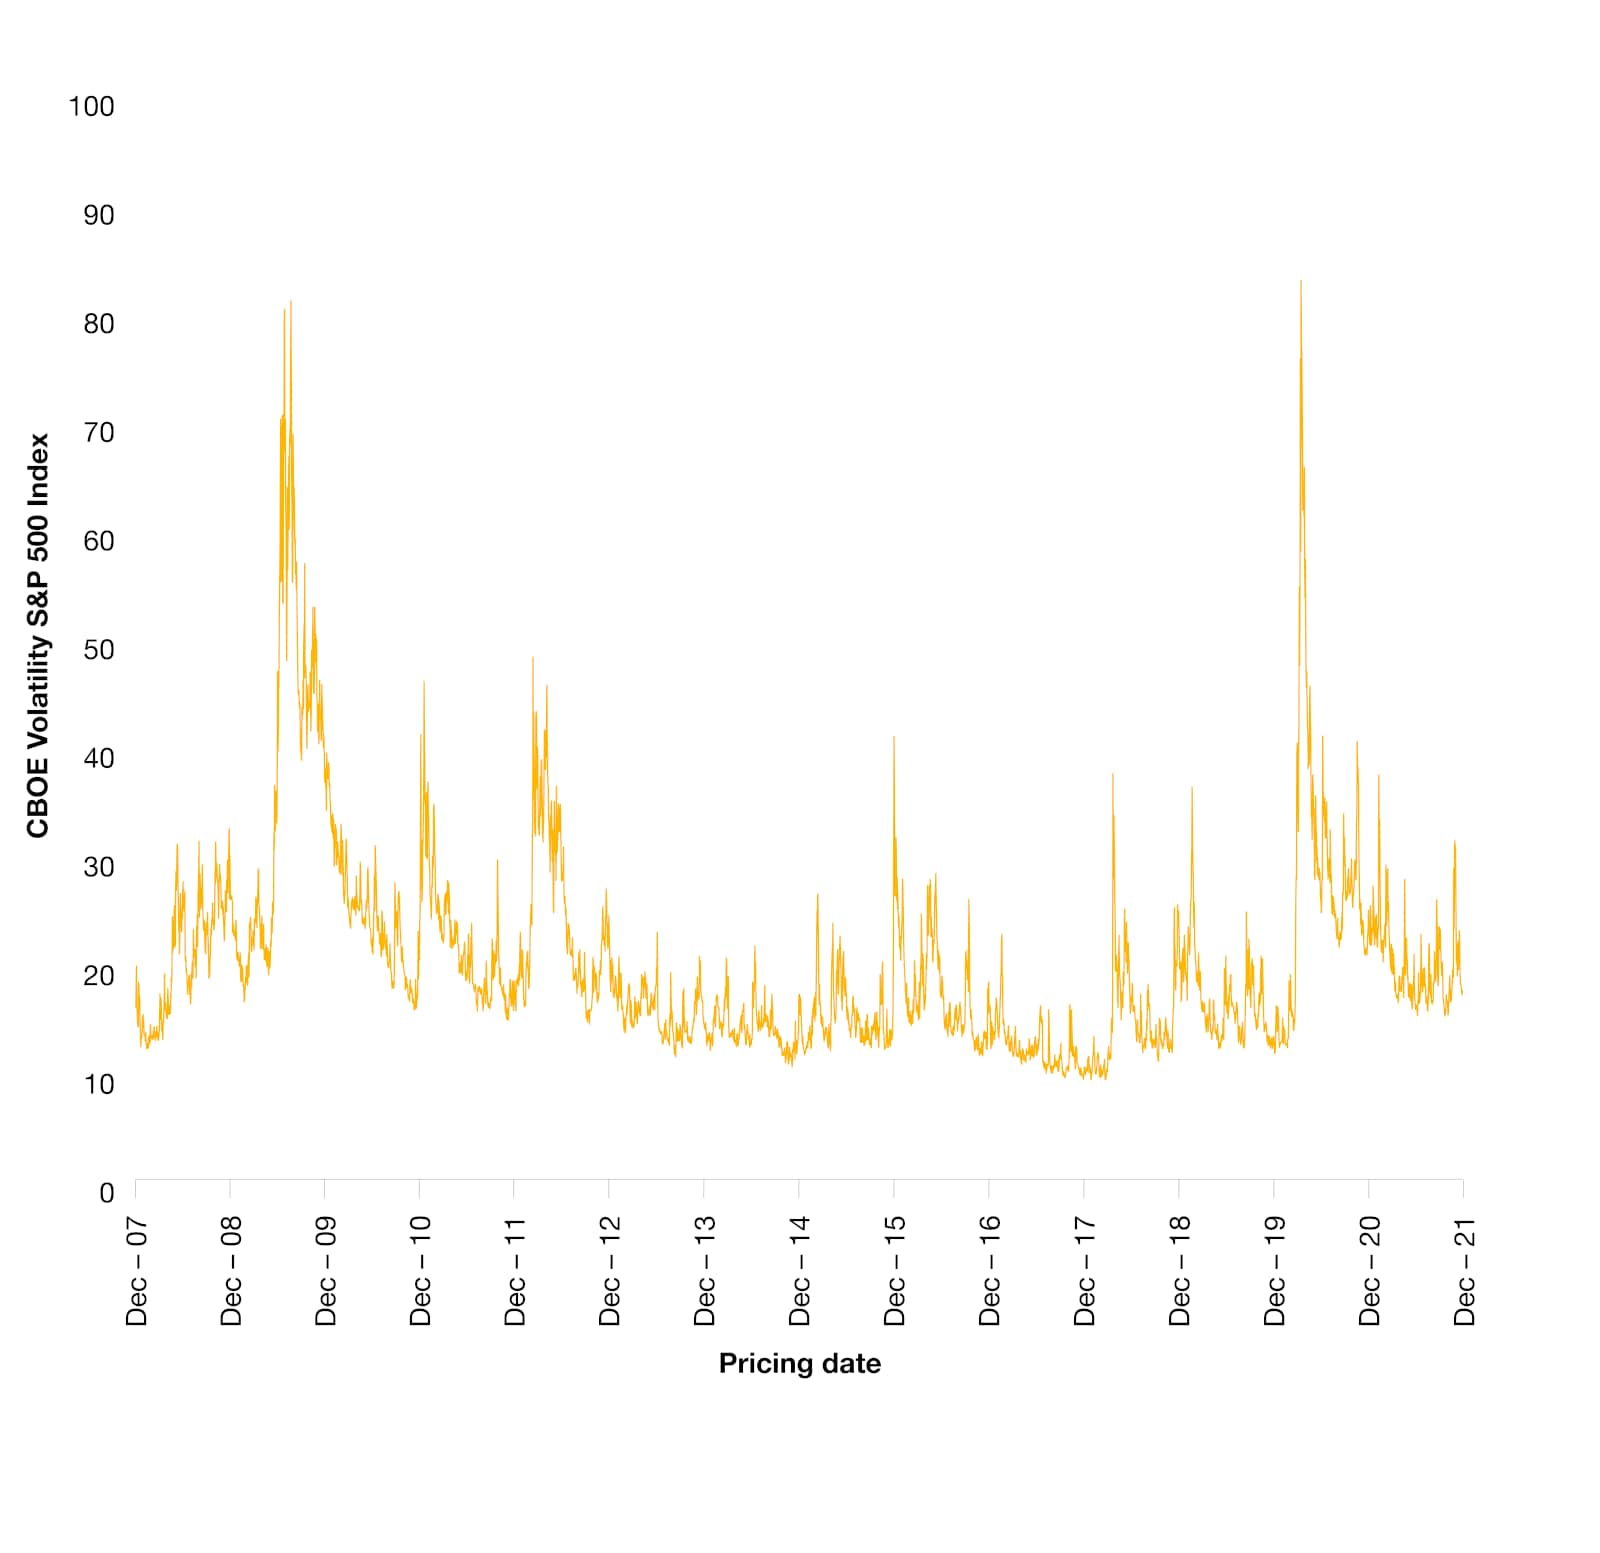
Since the beginning of 2020, we have observed significant volatility in global public equities (increases as well as falls in share price). In fact, the level of volatility in equity markets around the world in the early stages of the COVID-19 pandemic surpassed levels experienced at the start of the global financial crisis.
Whilst volatility has fallen back from these extremes, it remains slightly elevated relative to pre-pandemic levels, meaning that valuations will remain tricky and judgmental in the coming period particularly as the markets react to emerging information on the impact of new strains of the virus such as Omicron. In addition to this, the impact of the Deals Led Recovery is causing buoyant transaction pricing in certain sectors, following pent up demand from private equity ‘dry powder’.
We are sharing this guidance to emphasise that it remains possible to arrive at a view on value, albeit one with a wider range and to highlight the following key messages to help in dealing with the current uncertainty:
- Price vs. Value – Whilst it is always important to remember the distinction between the two, it is even more critical in the current market to ensure that it is possible to separate fundamental value changes from potential ‘noise’ in the pricing of public securities.
- Observe the relative levels of volatility at the valuation date and understand the related impact of uncertainty on valuations at a point in time – We advise against ignoring periods of increased volatility, which can reflect both increased uncertainty, but also increased optimism. Whilst this makes valuations more challenging, it is still our view that it is possible to perform robust valuations that reflect market conditions as at the valuation date.
- What’s the story underpinning the valuation – Valuations begin with numbers but closing a valuation requires telling a story that fits together. Valuations can make little sense when bringing together various pieces of data without stepping back to consider if they work in unison. This is a particular risk in the current environment given there have been significant movements in several fundamental valuation inputs.
This guidance provides recommendations for valuation considerations, which will be particularly relevant for impairment exercises and the fair value of unquoted investments. The methodologies that we have always applied will likely remain appropriate; what will need to be revised is the information that is flowing into the valuation and how we adjust market inputs if we feel that there is an element of ‘noise’, increased volatility (causing both positive or negative impacts) or uncertainty.
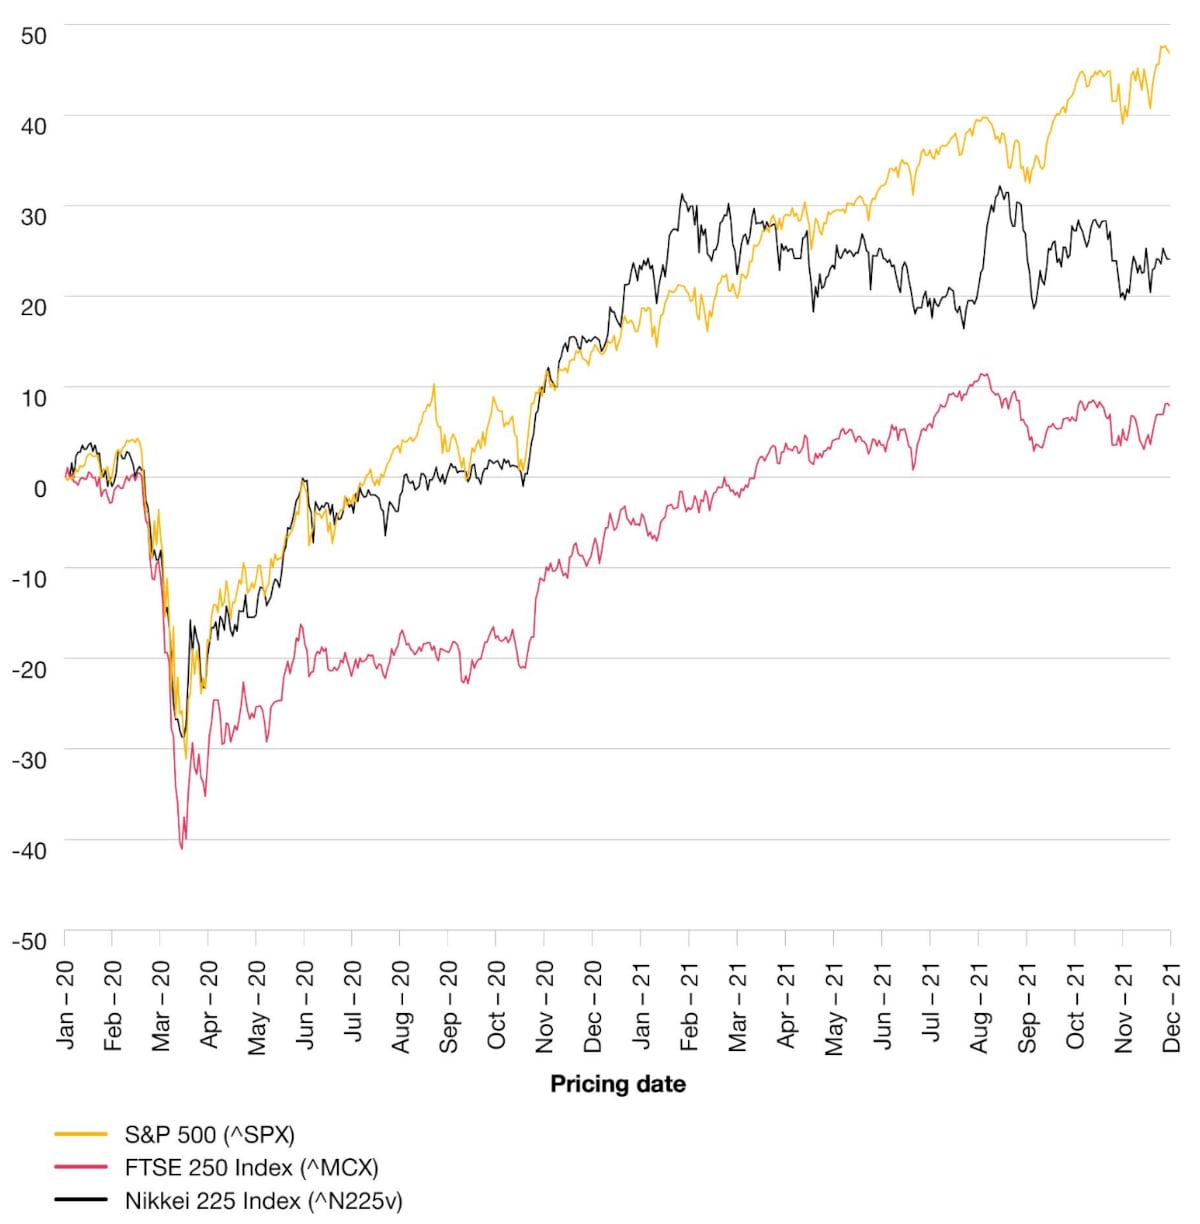
Movements in equity indices since 1 January 2020 to 31 December 2021
In March 2020, global stock markets turned ‘bearish’ with a decline in major equity indices around the globe. At their trough, the highest declines in indices ranged between 28% and 42% (Nikkei and FTSE 250 respectively) from their respective 2020 openings. The S&P 500, Nikkei 225 and FTSE 250 indices have since returned to, and exceeded, their January 2020 levels.
Although the initial declines in share prices were severe and the most rapid since the global financial crisis, with hindsight this may now be viewed as a phase where pricing ‘noise’ dominated value fundamentals. The degree of uncertainty was substantial as investors grappled with an unfamiliar event and struggled to assess its impact on businesses. This led to share prices fluctuating significantly on a day to day basis (and even within a single trading day).
However, stock markets regained a meaningful portion of the decline fairly rapidly which was then followed by a more gradual (albeit still volatile) recovery to levels close to or even exceeding pre-pandemic levels. Whilst volatility remains marginally higher than pre-pandemic levels, the recovery in share prices indicates that investors have become more accepting of the uncertainty that may persist in the market, and that pricing noise is lower than at the onset of the pandemic. This is the context in which valuations need to be performed in the current environment.
The recovery of market indices needs to be considered in terms of their sector weightings, which heavily influences their degree of recovery. The S&P 500 is weighted towards technology (28%) and healthcare (13%); two sectors which have proved to be more resilient to the effects of the pandemic and therefore have contributed to the rise in the index. Conversely, the FTSE 250 is highly weighted towards financials (37%), consumer discretionary (18%), and industrials (16%). The weightings towards technology (3%) and healthcare (4%) are minimal compared to the S&P 500. This weighting towards less resilient and robust sectors perhaps suggests why the FTSE 250 is still trailing behind other indices.
The share price performance across Q4 2021 reflects the ongoing global vaccination roll-out, which provided a much-needed boost for capital markets; particularly in the aviation, oil & gas and hospitality sectors. In addition the loosening of government imposed restrictions around the world during Q2 and Q3 2021, particularly in the UK and US, may have contributed to increased share price optimism during this period.
However, the reintroduction of government restrictions globally and voluntary social distancing in Q4 2021 as a result of new COVID-19 variants is reflected in a downturn in share price performance to 30 November 2021. Share price performance rebounded in December 2021, showing that markets may still be pricing an element of ‘noise’.
The decline in equity prices since February 2020 was the most rapid and sharp decline since the global financial crisis. Since then, some but not all indices have demonstrated a robust bounce back, often determined by the composition of their sector weightings.
Movements in equity indices since 1 January 2020 to 31 December 2021
Source: CapitalIQ as at close of 31 December 2021
Whilst we are recovering from the pandemic, we are currently in a period of transition with uncertainty surrounding what the future will look like
There are signs of recovery around the world with industry reopening and some international travel resuming in 2021. However, given the significant unpredictability of future government intervention and the corresponding impact on consumer and business confidence, there is uncertainty surrounding what the future looks like.
During this period of transition, it is important to consider the short and long term risk factors that will affect businesses, the corresponding impact on sensitivity analysis and therefore the valuation range.
The key factors driving this uncertainty include:
Click through the headings below to read more.
- Interest rates and inflation
- New COVID-19 variants
- Environmental and Social Governance (ESG)
- Labour market challenges
- Brexit
- China
- Venture Capital (VC) and technology
Interest rates and inflation
Factors including oil and gas prices, supply chain shortages and disruption, and the unwinding of government support for businesses are set to cause inflation to soar over the coming year, with the Bank of England (BoE) forecasting inflation to rise to 6% by spring 2022.
As such, the Monetary Policy Committee increased interest rates to 0.25% in December 2021 to counteract these inflationary pressures, and may consider further increases. In turn, this is set to cause significant uncertainty impacting on consumer and business spending, borrowing and therefore business valuations. This would have a two fold effect on valuations; impacting the discount rate (with the increase in the risk free rate reducing value) and cash flows (impacting margins).
Deals Led Recovery
Access to cheap capital has led to heighted deal activity and higher multiples, with deal volumes in the first 3 quarters of 2021 at over 90% of deal volumes achieved in 2020.
The availability and growth of private capital is driving deal volumes. Private equity houses had over $1.9trn of available ‘dry powder’ at the beginning of 2021, and Special Purpose Acquisition Companies (SPAC’s) raised more than $80bn during the first half of 2021. There are almost 400 existing SPAC’s that are yet to find a suitable target and as such forecasts estimate that this has resulted in nearly $0.5trn in buying power available to deploy over the next two years. This high level of urgency to find a target should result in stiff competition for deals and higher M&A values and volumes over the coming years.
The pandemic has increased the demand for healthcare and TMT assets, given their importance in the given climate. Healthcare sector multiples grew to 14.3x in Q3 2021 from 11.0x in Q2 2020 due to an increase in contracts from government for these services and the need for more health and social care providers to serve hospitals, nursing homes and foster care. With the pandemic still ongoing and the emergence of new variants, the demand for good quality healthcare assets is expected to remain high.
The technology sector continues to command a premium, driven by its asset light business model efficiencies and high gross margins. The significant increase and acceleration of tech adoption and digital trends driven by the pandemic is attracting more investment and deals activity. This has pushed traditional business models out of competition and made the TMT sector a highly popular investment approach.
The M&A market has also seen significant deal activity across all sectors over the past 12 months, driven by cheaper valuations, distressed M&A and the emergence and development of scope/capability driven M&A. Deal volumes in 2021 have already begun to reach levels seen over the previous years, even without the inclusion of Q4 2021. In fact, the first three quarters of 2021 saw deal volumes at 91% of the level seen throughout 2020 and 84% of 2019 total volumes, suggesting a return to pre-pandemic levels.
As such, PwC are terming this activity the ‘Deals Led Recovery’, where the continued emergence from the COVID-19 pandemic will be driven by deal volumes around the world. The competitiveness of the market reflects that businesses focus on value creation not only through cost-cutting measures but also by looking for revenue synergies that will fuel long term growth.
M&A activity has led the way out of the pandemic with unprecedented levels of activity. Deal volumes are expected to exceed 2020 levels and multiples have risen to reflect this increased demand
Source: Clearwater International.
Source: Clearwater International.
Data not available for Q4 2021 at the time of publication.
What are markets now indicating regarding valuation fundamentals?
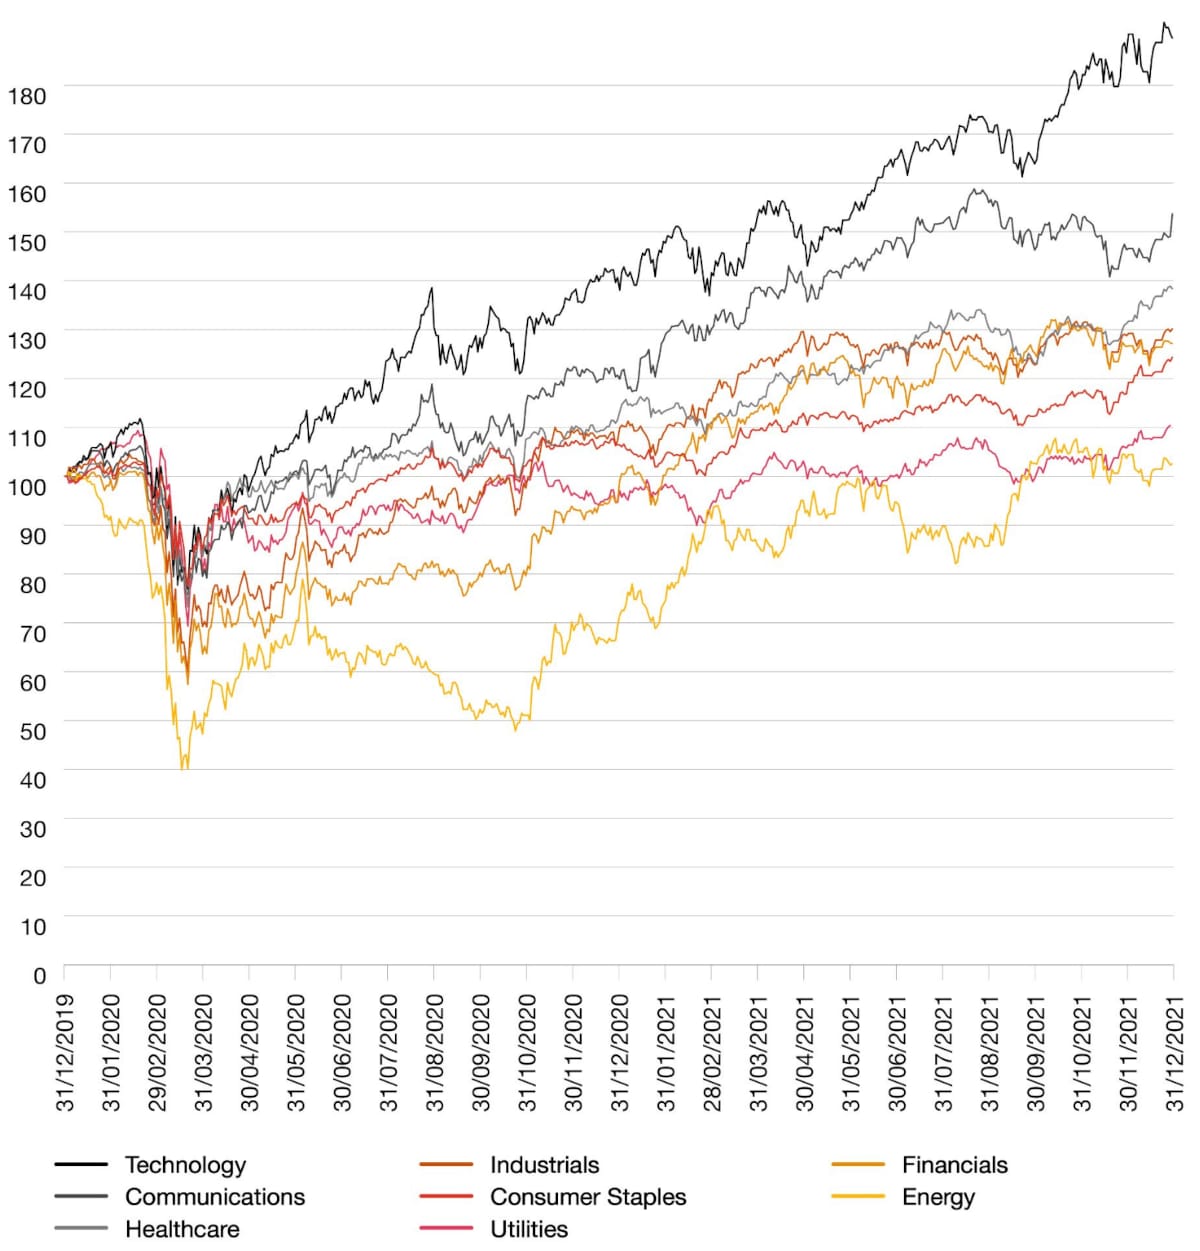
The gap between sector share price performance continues to widen, with sectors which are more resilient to COVID-19 performing strongly. It is important to note that even within sectors there can be large variances in performance.
The recovery of equity indices is only part of the story, as the level of recovery in share prices shows substantial variation by sector. In the early stages of the pandemic, all share prices experienced significant falls, perhaps as investors rushed to factor in the impact of the pandemic and made broad based judgements. As the crisis progressed and more information became available, the gap in share price sector performance began to widen and largely still persists.
Again, this provides further evidence of valuation fundamentals breaking through the pricing noise. Share prices in sectors more resilient to COVID-19 have performed more strongly for example in technology and healthcare, reflecting both the relatively stronger cash flows and the potentially less volatile outlook.
Share prices in the energy sector have not yet returned to their pre-pandemic levels, with significant Brent oil price volatility expected in the short term despite its upward trajectory following tighter supply and improving demand. There is a widely held view that oil demand is now expected to recover to pre-pandemic levels by 2022-2023. These increases in oil prices may likely boost energy transition strategies of oil and gas companies in the near term. The recent gas price rally was a function of strong Asian LNG (liquified natural gas) demand, low European stocks (storage and gas production) and increasing carbon prices. This has highlighted deficiencies in the UK’s supply of gas, with Qatar now asked to be the UK’s gas supplier of last resort.
It is important to note that even within each sector there can be large variances. For example within retail, consumer facing workers are experiencing real wage declines as opposed to online retail workers who are benefiting from a higher wage. Another example is in the energy sector, where very different trends can be seen in oil & gas and wind farms. Oil & gas extraction is experiencing a slow recovery with output 17.6%1 lower than it was 2 years ago.
This highlights the importance of being able to tell the valuation story for each individual company. Whilst there will be cases where lower discount rates support higher valuations, this is not a blanket rule that should apply to all companies regardless of their situation. Clearly there will also be cases of companies where cash flows are much lower and uncertainty is currently very elevated; it is unlikely that lower discount rates will be appropriate in these instances.
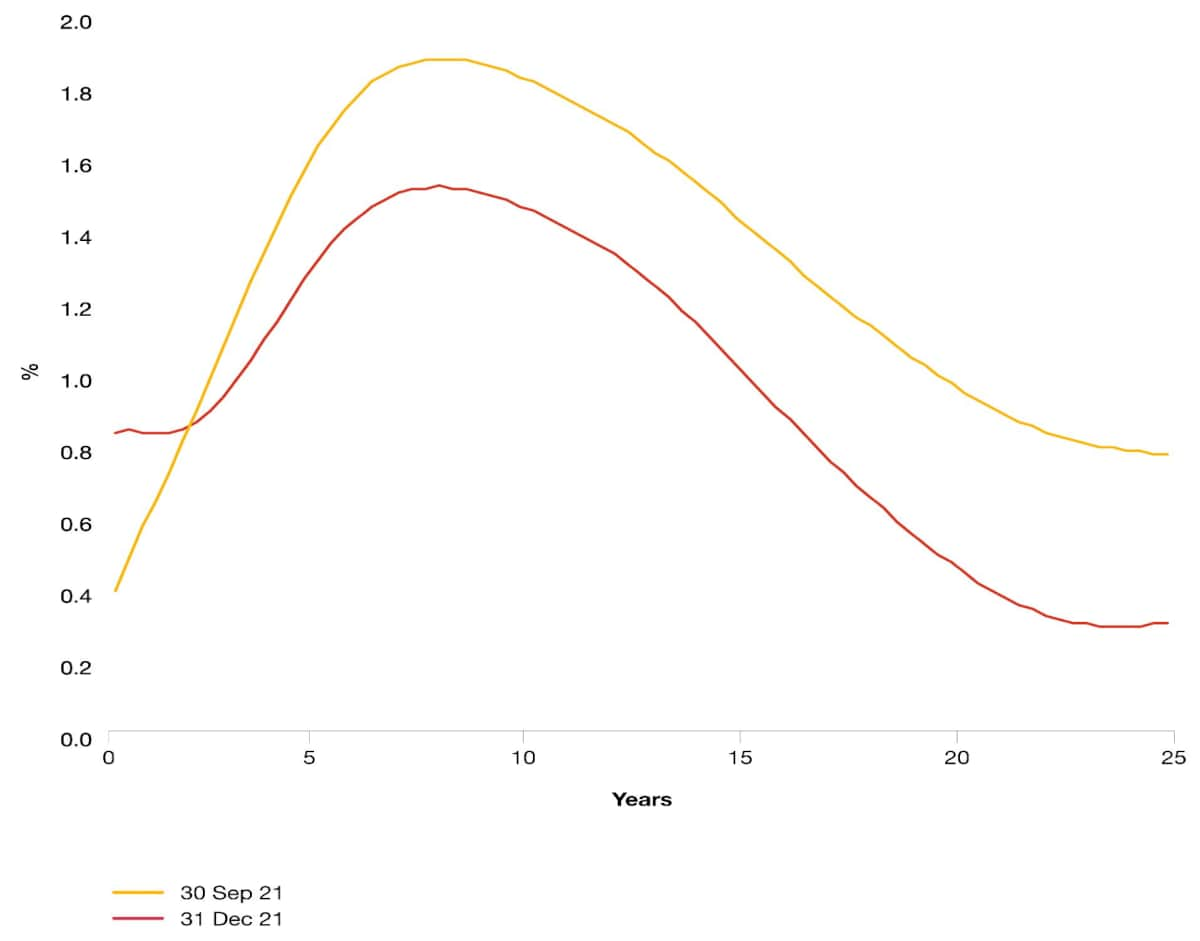
Recent market occurrences have led to an expectation that interest rates will rise significantly over the next 12 months and fall thereafter, however the impact of new COVID-19 variants is still unknown and may delay interest rate increases.
In December 2021 the BoE raised the base rate of interest for the first time since the onset of the pandemic to 0.25% from historic lows of 0.1%, to curb the pressures presented by rising prices and bring inflation back towards the BoE’s 2% target.
Inflation in the UK reached 5.1% in November 2021, the highest in a decade since September 2011 when it was 5.2%. Inflationary pressures have been caused by factors including supply chain issues, a buoyant labour market and significant rises in energy prices (with household energy gas bills increasing 28.1% in the year to October 2021).
The BoE expects inflation to peak at 6% in spring 2022, coinciding with an increase in the energy price cap and the scheduled reversal of the VAT cuts for hospitality and tourism industries. Inflation is currently expected to fall in the second half of 2022 and throughout 2023 as the impact of these factors reduce and supply chain issues ease.
Low interest base rates are expected to persist for some time, although there is uncertainty as to whether there will be further rate increases in the next few years to dampen surging inflation.
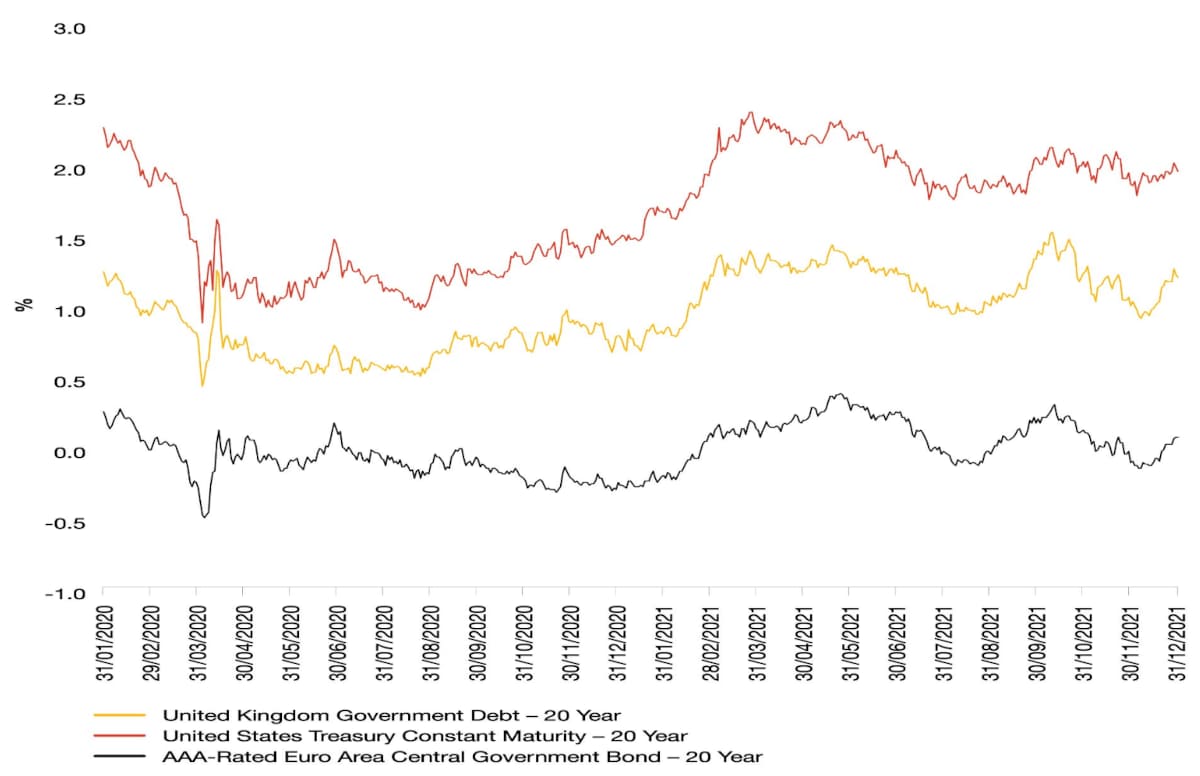
Risk-free rates were unusually volatile in March 2020 but ended Q3 2021 around 0.25% lower than the start of the 2020, in each of the UK, US and Eurozone. Debt margins on borrowing initially increased significantly but are now at generally similar to levels at the start of the pandemic.
Risk-free rates fluctuated in March 2020 but ended Q4 2021 on average 0.18% lower across the UK, US and Europe relative to January 2020. As with the equity markets, it is difficult to gauge whether gilt yields reflect long term expectations or are a short term reaction to government policies such as quantitative easing.
The risk-free rate is a key input into all discounted cash flow (“DCF”) valuations and a lower rate would, all else being equal, indicate lower discount rates on a broad market basis than pre-pandemic. Furthermore, the fact that both debt margins and share prices have largely returned to pre-pandemic levels is a further indicator of lower, rather than higher discount rates.
Lower discount rates may seem somewhat counterintuitive given the uncertainty and volatility that is present but it is likely to be at least part of the story required to rationalise the share price recovery. In a sense, investors have now come to terms with the uncertainty that is present, and we should do the same in our valuations.
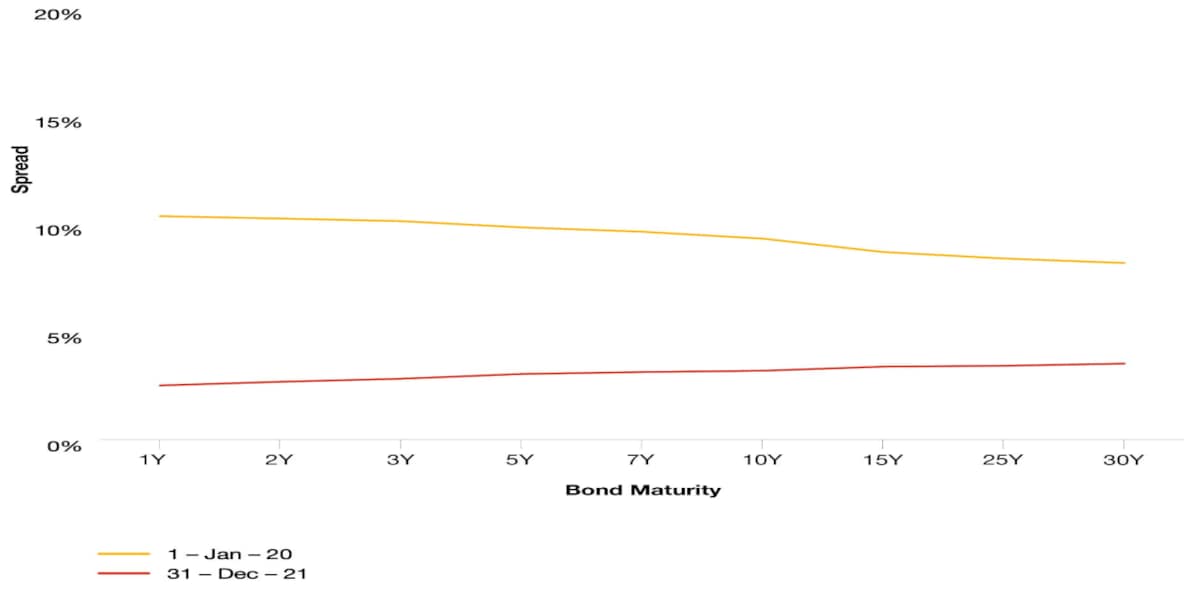
Debt margins on borrowing initially increased sharply but have since fallen back and generally ended the year below levels seen prior to the start of the pandemic. This is partly due to the ‘flight to quality’ with investors shifting out of stocks and into bonds (particularly investment grade) during times of volatility. This essentially mirrors the initial nervousness that caused share prices to drop sharply before staging a recovery over the rest of 2020 and 2021. However, whilst average market spreads on bonds at investment grade ratings have returned to pre-pandemic levels, in sectors significantly impacted by COVID-19, companies may have experienced credit rating downgrades, which will likely result in them facing increased borrowing costs.
UK valuations team guidance on how to reflect the increased focus on ESG in valuations
ESG is a key driver of change for businesses and may impact value. There are currently no universally accepted ESG ratings against which companies can be benchmarked, with information often volunteered by companies as opposed to audited.
Traditional valuation approaches are still valid when considering ESG, but they need to be robustly applied to capture how a company is perceived by its key stakeholders and the potential consequences on cash flow.
The quantification of ESG remains judgemental, but the value impact of ESG typically falls into three buckets:
- Market based approach: relying on a quoted company share price to illustrate the impact of ESG actions on value. ESG rating systems are still early stage and share prices are typically too volatile and all-encompassing to draw out the impact of individual ESG issues, making this approach tricky to use in practice;
- Subjective adjustments: tweaking the discount rate or terminal value assumptions in a discounted cash flow analysis. Better than simply relying on the market evidence in option A, but too subjective for valuers to rely on - how much do you tweak a discount rate or terminal value by, when there is insufficient market data to tie it to?; or
- Direct cash-flow adjustments: This approach is the most meaningful, by identifying those ESG elements most critical to the company's success and value and financially model these. This could include exploring what the most material ESG demands of key stakeholders are, then assessing the costs to meet or exceed them and the financial implications of doing so.
ESG and climate change strategies being pursued by businesses should be considered as appropriate in cash flow forecasts. Direct adjustments could include:
- Customers - What ESG issues are most material to customers (e.g. it may be waste rather than CO2 emissions) and benchmark performance in these areas against competitors. Then consider price elasticity of different customers to estimate whether this will enhance or destroy brand value through changes in demand or discounted/premium pricing.
- Employees - What ESG issues are most material to employees, and benchmark performance against competitors. Consider the extent to which this has a meaningful impact on employee retention and talent recruitment, as this will drive cash flow. For example, employee retention may be more relevant for sectors where there are long standing relationships such as in consulting and business services, whereas employee ingenuity and innovation may be more relevant to a technology business.
- Regulators and supply chain - compare forecast emissions against forecast energy prices, e.g. capturing expected changes in carbon taxes, as increases in taxes may well flow up through the supply chain to impact cash flow.
- Terminal value - what are the long term prospects for customers in the sector - consider whether they will move to greener substitute products or services that emerge, as this will need to be reflected in estimates of market share and size and therefore terminal value beyond the explicit forecast period.
When applying a market based approach, publicly available market evidence (such as transaction multiples, listed share prices or commodity prices) may already reflect the potential impact of climate change to the extent that they are reflective of the market’s pricing of the transition to a lower carbon economy, climate change risk and other ESG risks / opportunities. However it is difficult to ascertain specifically what is included / excluded from publicly available market data.
We therefore recommend that the impact of ESG is reflected in the cash flow projections of a company, rather than in a discount rate or terminal value adjustment, with the exception of the following cases:
- In certain energy intensive sectors (such as oil and gas) where there is evidence of the impact on cost of debt and cost of equity; and
- If the company’s view on ESG risks is relatively optimistic, a potential alpha premium may be considered to counteract this.
Read more on pricing ESG into valuations
UK valuations team guidance on valuation in times of market uncertainty
Points of debate
- Observable transactions or trading multiples generally serve as benchmarks in the fair value concept. Can valuers still use recent asset transactions or trading multiples taken from stock prices as appropriate benchmarks? Whilst 2021 has seen heightened deal activity (with record multiples), transaction multiples may include acquirer specific synergies which may not be relevant to other businesses.
- With the significant recoveries seen in the equity markets, the more pertinent question to ask may be whether projections have been appropriately adjusted for changes in earnings and balance sheet values as a result of issues with the supply chain, expected changes in the demand for products/services and the wider risks in the market including the impact of interest rates, inflation, ESG, Brexit and China.
- Companies with high levels of debt and/or limited debt servicing headroom (e.g. because they have low operating margins or low cash flow conversion, particularly where costs are fixed e.g. salaries, rent) have an increased likelihood of liquidity issues, especially with the winding down of government support, and this should be captured in valuations accordingly. Whilst debt margins have returned to pre-pandemic levels as investors returned to the market to invest in resilient companies, companies in more significantly impacted sectors may have experienced credit rating downgrades which will likely lead to increased borrowing costs.
- Share prices fell significantly in early 2020, which clearly impacted multiples (as earnings estimates took some time to be adjusted downwards). However, now that earnings forecasts have generally been adjusted, the more prescient issue is how to ensure that any benchmark multiples are being applied to appropriately revised cash flows and reflecting any differences in expected recovery profiles.
- Given the future uncertainty, do valuers need to make any adjustments to the way in which we usually calculate discount rates or to specific inputs such as the equity market risk premium?
Actions to take (for all types of valuations)
Click through the headings below to read more.
- Projections
- Balance sheet items
- Going concern versus gone concern
- Illiquidity adjustments to discount rates
- Cost of capital
- Sector considerations
- Beta
- Cost of debt/gearing
- Use of spot share prices for trading multiples
- Public market volatility
Projections
- Revisions to projections: In relation to cash flow projections or maintainable earnings, we recommend thorough discussions and challenge with the providers of projections on whether and how, the implications of the events discussed are fully reflected in management’s expectations (e.g. changes in revenue, growth rates, margins, capital expenditures, unwinding of government support, impact of ESG, Brexit, China etc.). Given the significant changes in the financial markets throughout 2020 and 2021, and in expectations of business performance, the date at which the projections were prepared should be considered as well as other external factors including foreign exchange rates.
- Projections should, where possible, be compared to market evidence and will need to reflect a much higher probability of a weak economy in the short to medium term. In the case of discounted cash flow (DCF) analysis, if the projections cannot be updated, an ‘alpha’ factor may need to be applied to the discount rate which will clearly require consultation and judgment to reflect company and industry specific factors.
- Note that discount rate adjustments to correct for overstated cash flows are not best-practice as, without additional analysis, the concluded alpha may under- or overstate the correction. Under limited circumstances where alpha may be unavoidable, e.g. cash flows cannot be rigorously adjusted in a timely manner, practitioners should conduct additional analysis to consider and assess the reasonableness of the cash flow impacts implied by the risk premium (i.e. back solve to the implied forecast and discuss with management).
- Alpha adjustments should not be confused with illiquidity adjustments to discount rates, which are covered later in this guidance. Alpha is a specific risk premium because the set of cash flow projections being used may not be ‘expected’ cash flows. There may be some ‘downside’ scenarios missing from the ‘probability weighted average’ set of projections.
- Scenarios for projections: Different cash flow scenarios could be a useful way of understanding the range of potential outcomes for a business and its attached risks. For example, a business as usual scenario, a scenario with short/medium term disruption and a scenario with a broader and longer economic downturn. This is an increasingly important piece of analysis given the current period of transition and uncertainty.
- Long term growth rates: Long term growth rate assumptions should reflect market participants’ long term estimates for inflation and real economic growth, adjusted to reflect the outlook for the sector that a company is operating in as well as company specific factors. Typically the effects of new industries and technologies and the impact of competition within industries may limit company specific long term growth rates to a lower level than for the economy as a whole to at least some degree. However, the long term sector and company specific outlook may well have changed as a result of COVID-19, with some sectors demonstrating stronger growth and more resilience and others being relatively weaker than previously expected. The overall drop in risk-free rates, and indeed discount rates more broadly, is also arguably consistent with a reduction in long term economy wide nominal growth expectations to at least some degree, due to changing expectations of inflation and/or real economic growth. It is therefore important that the discount rate and long term growth rate assumptions used within a valuation are internally consistent, otherwise the capitalisation rates / multiples implied within terminal values may not be realistic or reconcilable with market data.
- Discrete projection periods: Given the significant impact of terminal value calculations on overall DCF valuations, valuers may need to extend the discrete project period or perform some level of sanity checks on the terminal value (for instance by considering the multiple implied by the terminal value).
Key take-aways
In the current climate, financial reporting valuations need to consider not only the turbulence and volatility in public markets but also the impact on cash flows, growth rates and margins of recent developments related to COVID-19 and we reiterate the following three key messages:
Contact us

Deals Chief People Officer and Valuations Partner, PwC United Kingdom
Tel: +44 (0)7739 877541


