Net Zero Economy Index 2022

Economy-wide net zero ambitions continue to scale up, but progress on decarbonisation over the past 12 months has declined.

Our Net Zero Economy Index (NZEI), an indicator of the progress G20 members have made in reducing energy-related CO2 emissions and decarbonising their economies, shows that at just 0.5%, the global rate of decarbonisation in 2021 was at its lowest level in over a decade.

With further economic headwinds and energy price challenges ahead, countries – and businesses – have important decisions to make if they are to place decarbonisation efforts at the heart of their economic futures.

“This year’s results are an urgent reminder that we must act to meet ambitious net zero targets. By accelerating policy change and investment opportunities, nations can unlock resilient and affordable energy, clean and productive industry, and a healthy and just society. Businesses too seem poised to capture new opportunities, but how can we put climate action at the top of the transformation agenda?”

Emma Cox,Global Climate Leader, PwC UK

The global picture

Net Zero Economy Index 2022

“Achieving a 15.2% annual rate of decarbonisation is now needed to bridge the gap between the climate emergency and a strong and sustainable economy. We've seen a willing appetite for change, but this is set against a fragile geopolitical and economic backdrop. Soaring energy prices, and the need to stimulate economic growth following the pandemic, have hampered recent progress. Persevering with action and investment now will set nations on the right path towards a net zero economy.”

Dan Dowling,Partner, Net Zero Strategy & Transformation, PwC UK

Our findings

The global rate of decarbonisation in 2021 was just 0.5%

To limit warming to 1.5°C, the annual global rate of decarbonisation needs to reach 15.2%

Global carbon intensity needs to drop 77% by 2030, against a backdrop of geopolitical and economic uncertainty

Each country and sector will have its own route to take to achieve net zero

The climate agenda is increasingly part of business and investor decision making

More than ever before, there is an urgent imperative for strategic collaboration

< Back

< Back
[+] Read More

Our metrics and methodology

For details on our methodology and key metrics - including fuel factor and energy intensity - find out more in the methodology and metrics section below.

Methodology

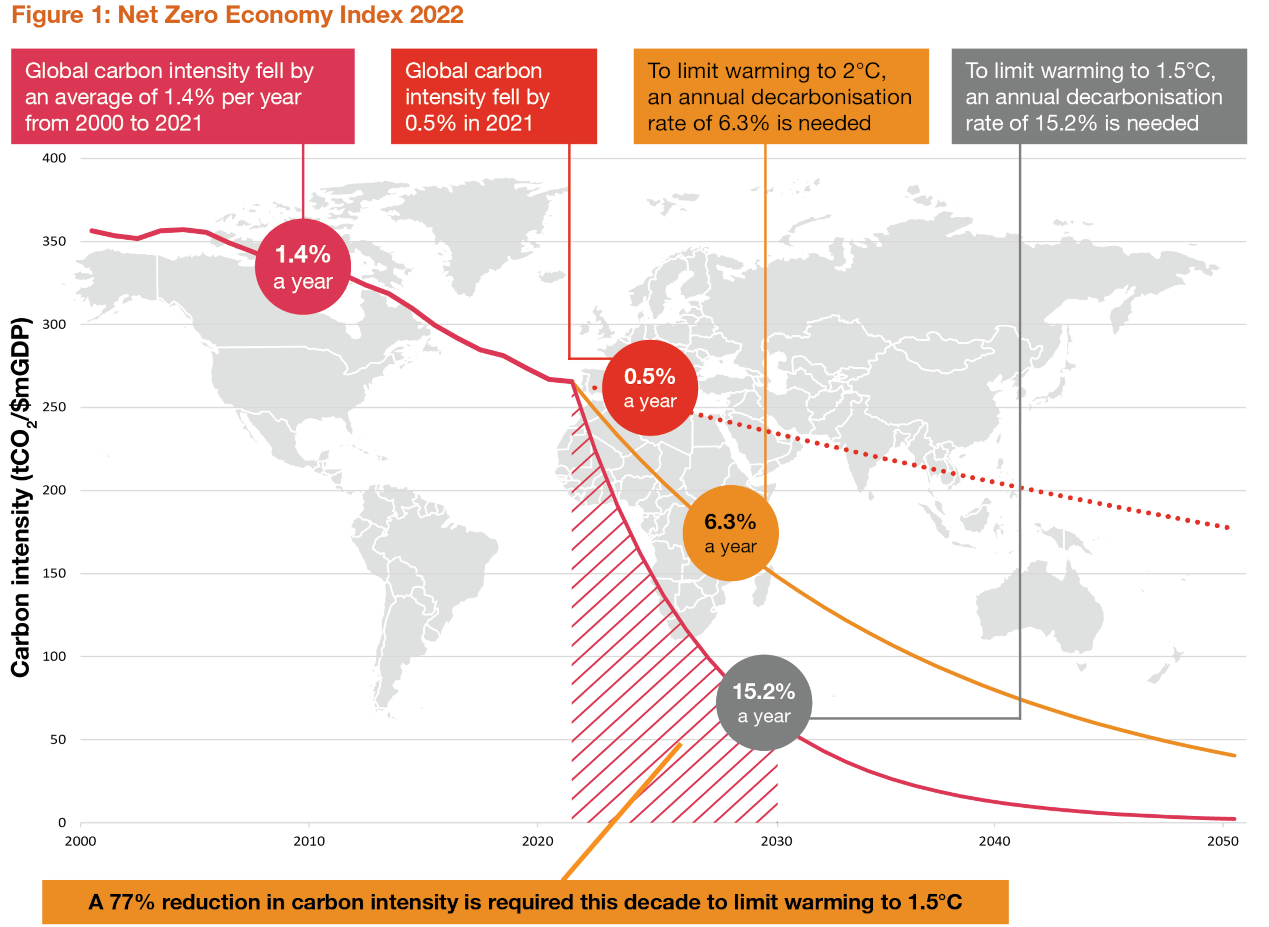
The Net Zero Economy Index tracks the decarbonisation of energy-related CO2 emissions worldwide.

The analysis is underpinned by bp's Statistical Review of World Energy, which reflects energy consumption per fuel type per country and CO2 emissions based on the consumption of oil, gas and coal.

Global carbon budgets refer to the global estimated budget of fossil fuel emissions taken from the IPCC Special Report on Global Warming of 1.5°C. A series of assumptions underpin these carbon budgets, including the likelihood and uncertainties of staying within the temperature limits, and the use of carbon dioxide removal (CDR) technologies.

AFOLU (Agriculture, Forestry and Other Land Use) emissions and non-CO2 emissions are excluded from this analysis. No carbon sequestration is accounted for in the Net Zero Economy Index analysis. As a result, this data cannot be compared directly with national emissions inventories.

GDP is measured on a purchasing power parity (PPP) basis.

Our data sources include: bp, IEA, World Bank, OECD, PwC

G7 comprises: Canada, France, Germany, Italy, Japan, the United Kingdom, and the United States

E7 comprises: Brazil, China, India, Indonesia, Mexico, Russia, and Turkey

G20 comprises: G7 countries, E7 countries, Argentina, Australia, Korea, Saudi Arabia, South Africa, and the EU.

Carbon intensity

The primary purpose of the Net Zero Economy Index is to calculate national and global carbon intensity (CO2 / GDP), and track the rate of change needed to limit warming to 1.5°C.

To do this, we use the IPCC carbon budget to calculate how much emissions need to be reduced in the future, and divide this by the projected increase in GDP.

This allows us to see the amount emissions must reduce to maintain projected GDP growth, providing insight to the scale of efforts required to decouple emissions from economic growth.

Fuel factor

The fuel factor (CO2 / energy) measures how much CO2 is emitted per unit of energy consumed. Put simply, how green the energy consumption is.

It indicates a country’s shift in energy mix towards renewable energy sources, and can reflect movements away from the most highly emitting fossil fuels (such as coal).

For each unit of energy consumed, different fossil fuels will release differing amounts of CO2 emissions. For each unit of energy consumed from a renewable source, emissions will be reduced to negligible, or zero, therefore reducing the fuel factor toward zero.

Energy intensity

Energy intensity (energy / GDP) measures the amount of energy consumed per unit of GDP generated.

It shows us how much energy is needed to generate a given amount of GDP.

Energy intensity is impacted by a range of factors, including: energy efficiency, in the form of policies, standards and technological advances; pricing and behavioural change; the sectoral composition of an economy; investment in more efficient technology and infrastructure; and climatic influences on energy usage.

Contact us

Emma Cox

Emma Cox

Global Climate Leader, PwC United Kingdom

Dan Dowling

Dan Dowling

Partner, Net Zero Strategy & Transformation, PwC United Kingdom

Tel: +44 (0)7715 487335

James King

James King

Senior Manager, Sustainability, PwC United Kingdom

Tel: +44 (0)7706 285078

Josh Huntley

Josh Huntley

Senior Associate, PwC Sustainability, PwC United Kingdom

Tel: +44 (0)7483 407354

Follow us